- Qualys shares closed on 10/23/2026 at $216.70, an all-time high: +63% in 2026 and +184% from the April low.
- In Q2 2026, it generated €182.2 million in revenue (+11%), with an adjusted operating margin of 45%, no debt, and around €703 million in cash and investments.
- It repurchased shares at an average price of around $96 in Q2; today it trades at 9.7x sales and 37.5x GAAP earnings (my own calculation).
Stocks
Qualys shares: from AI panic to an all-time high
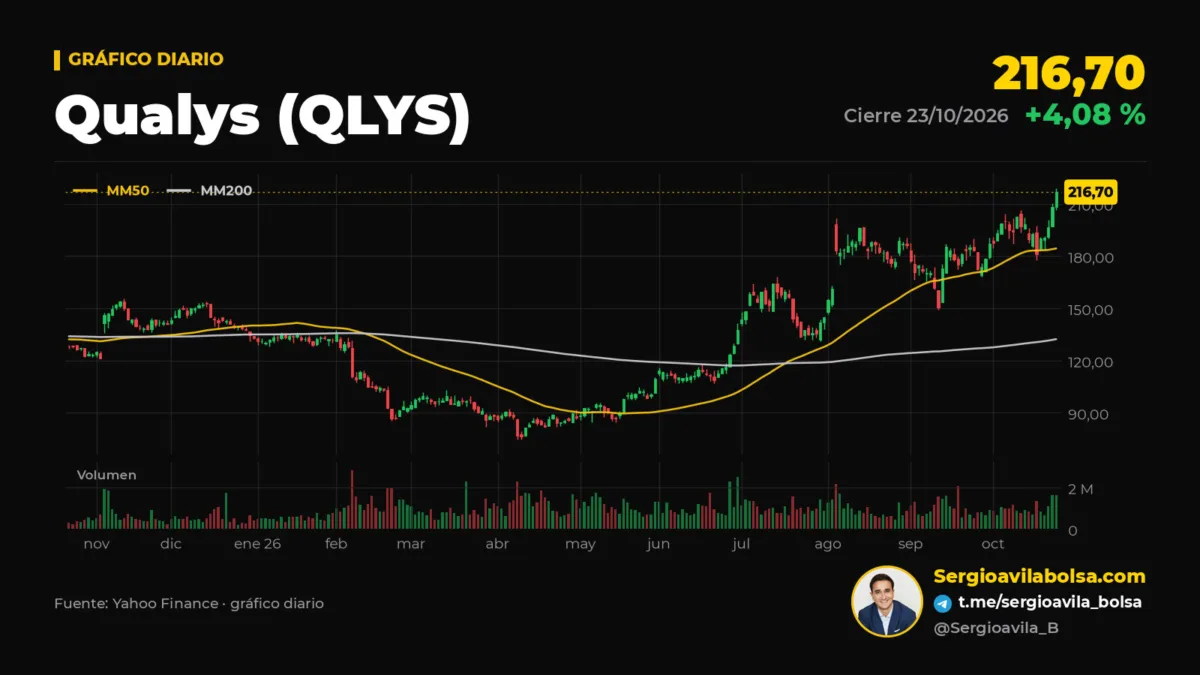
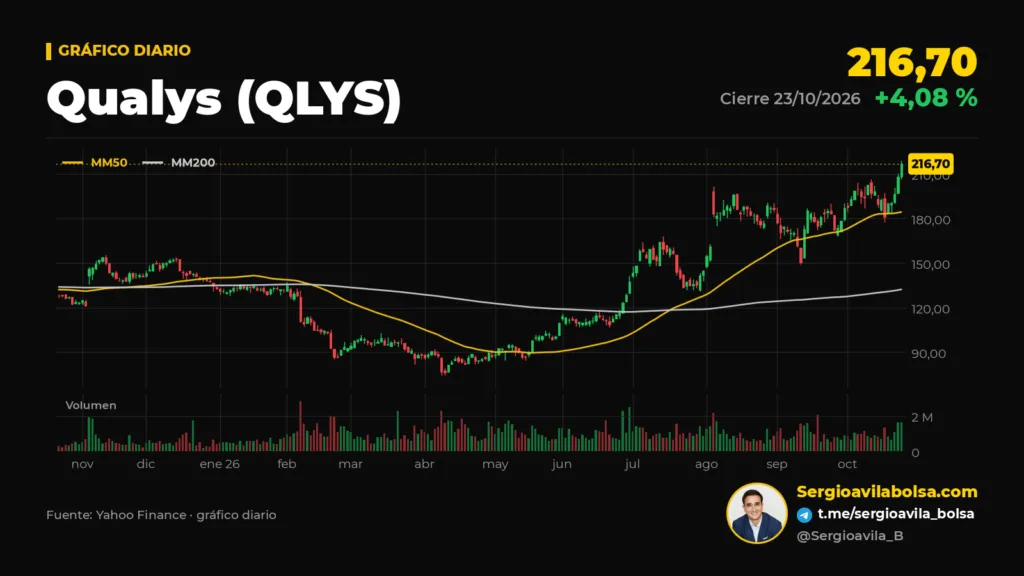
In April, the market signed Qualys’s death certificate. Six months later, the stock is at record highs. Qualys shares closed on Friday, October 23, at $216.70, up 4.1% on the day, for their best close since listing. They are up 63% in 2026 and 184% from the April 10 low ($76.20). That spring, investors had decided that artificial-intelligence models capable of finding software bugs on their own would make unnecessary the very companies that sell that service: vulnerability detection.
The company is the same. So is the business. What has changed is the narrative. And, as is almost always the case when an asset price moves much more than its fundamentals, I’m more interested in the second than the first: what Qualys did with its cash while the market changed its mind about it.
Qualys key figures: Qualys shares
| Indicator | Figure | Period |
|---|---|---|
| Close | $216.70 (+4.08%), all-time high | 10/23/2026 |
| Stock market performance | +63.1% year to date; +184% from the $76.20 low | 12/31/2025 and 04/10/2026 to 10/23/2026 |
| Revenue | $182.2M (+11%) | Q2 2026 |
| GAAP / non-GAAP operating margin | 34% / 45% | Q2 2026 |
| Free cash flow | $149.5M (42% normalized margin) | 1H 2026 |
| Net retention | 105% (103% at the start of the year) | Q2 2026 |
| Buybacks | $130.7M (1.30M shares); Q2 at an average of ≈$96 | 1H 2026 |
| Cash and investments / debt | ≈$703M / 0 | 06/30/2026 |
| 2026 revenue guidance | $732–738M (+9–10%); in February, $717–725M | Guidance from 08/04/2026 |
| P/E (GAAP EPS / 12-month non-GAAP EPS) | 37.5x / 28.3x | Price as of 10/23/2026 |
From April panic to October record
The selloff had three acts. On February 6, Qualys published 2026 guidance that disappointed: revenue of $717 million to $725 million, growth of only 7–8%, and adjusted EPS below consensus expectations. The stock lost 13% in one session. At the end of that month, Anthropic unveiled an AI code-review tool and the cybersecurity sector suffered another wave of selling. In April came the third act, with Claude Mythos, a model capable of uncovering software flaws at a scale that, according to some venture capital investors, made vulnerability-management companies the most threatened in the sector. On April 9, Qualys fell another 13%. From the end of 2025 to the April low, the stock lost 43%.
The recovery came in two phases. The first was with second-quarter results (August 4): revenue 11% higher, current billings growing 16%, and full-year guidance raised for the second time, to $732 million to $738 million. The stock rose almost 14% the next day. The second is from this very week. On October 21, two critical bugs were disclosed in PHP, the language used by around 70% of websites, allowing remote code execution on affected servers. An Evercore ISI survey of distributors also pointed to firmer cybersecurity budgets heading into year-end. On Friday, Qualys offered free services to find and fix them, and the whole sector moved higher: CrowdStrike up 8%, Tenable up 6%, Qualys up 4%.
In other words: the same technology that in April was supposedly going to leave Qualys without a business is what in October makes it indispensable. Management’s thesis, repeated on the August call, is that AI accelerates both the discovery of vulnerabilities and their exploitation, and that this shifts value from finding flaws to fixing them before anyone can use them. In the words of CEO Sumedh Thakar: “You can’t solve a minutes problem with a month solution.”
What the price has discounted and what the business has delivered
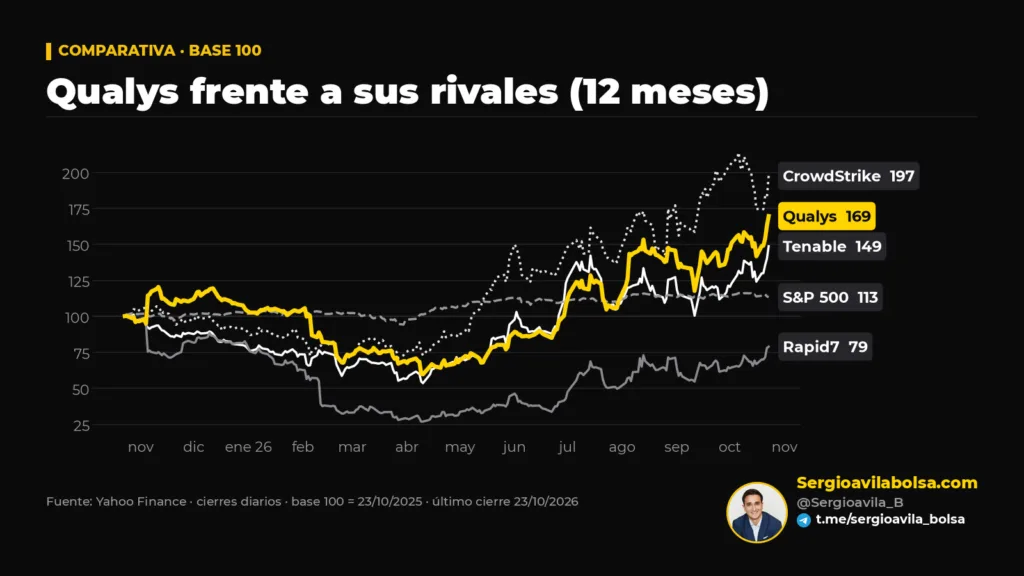
Let’s put the two moves side by side. From the April low, the stock has almost tripled. Over the same period, 2026 revenue guidance has moved from $717–725 million (February) to $732–738 million (August): an improvement of about 2%. Adjusted EPS guidance has risen more, from $7.17–7.45 to $7.74–7.88, partly because there are fewer shares over which to spread it.
There are genuine operational signs. Net retention (how much more an existing customer spends each year) has moved from 103% to 105% year to date. The new risk-management and patch modules already account for 14% and 16% of new bookings. The distributor channel is growing 22%. But management itself was cautious in August: the demand sparked by Mythos is still at the stage of conversations and trials, not signed contracts. And CFO Joo Mi Kim acknowledged that they are not seeing “any significant increase or acceleration in the sales cycle” for customers renewing in the second half of the year. The basis for second-half current-billings guidance is 7–8% growth.
In other words, the market has gone from pricing in obsolescence to pricing in a reacceleration that the company has not yet promised.
Capital: what Qualys did when the stock was on the floor
What interests me most in this case is not the narrative, but what the company did with its money while the narrative was changing. Qualys is a rarity in software: 45% adjusted operating margin, no debt, about $703 million in cash and investments, and free cash flow that totaled $149.5 million in the first half. It pays no dividend. Its way of returning capital is share repurchases.
And it bought shares back when they were cheap. In the second quarter it retired 797,036 shares at an average price of about $96 (in April, at $84.71). Those shares trade today at $216.70. In the first half it allocated $130.7 million to buybacks, and the average diluted share count has fallen 4% year over year. This is the kind of capital allocation that is often preached and rarely practiced: buying with the wind against you, with your own cash and without taking on debt.
The downside of that same logic is uncomfortable. At the current price, every dollar spent on buybacks retires less than half the shares it did in April. And stock-based compensation to employees (about $78 million over the last 12 months, or 11% of revenue) keeps diluting on the other side. At $216, buybacks are no longer an obvious bargain; $229.8 million remains authorized. What management does with that over the next few quarters will say more about its discipline than any presentation.
Valuation: what I’m paying for Qualys versus its peers
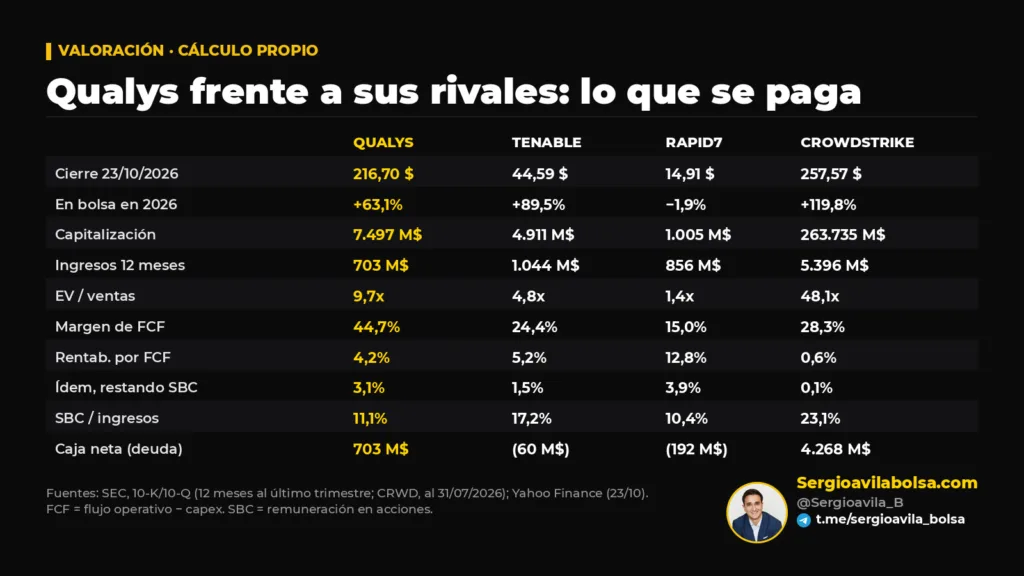
Based on the last 12 months of data, Qualys trades at 9.7 times enterprise value to sales and offers a 4.2% free cash flow yield. At 37.5 times GAAP earnings (28 times adjusted), it is not a cheap stock in absolute terms. But context matters:
- Tenable, its most direct peer, trades at 4.8 times sales, although it converts a much smaller share of revenue into cash (24% versus Qualys’s 45%). It also has stock compensation equal to 17% of revenue and carries net debt.
- Rapid7 trades at 1.4 times sales and is the example of what the market does to a company that fails to convince: down 2% in 2026, in a year when the rest of the sector has risen sharply.
- CrowdStrike, at the other end, trades at 48 times sales and offers a free cash flow yield of 0.6%. If you subtract what it pays in stock compensation (23% of revenue), that falls to 0.1%.
If you subtract stock compensation from the cash generated — a real cost even if it does not come out of cash on hand — Qualys offers 3.1% on its market cap. That is higher than Tenable’s 1.5% and far higher than CrowdStrike’s 0.1%. What those figures show is a sector in which capital continues to flow toward the promise of growth more than toward available cash. When money is abundant and the narrative is powerful, the price of the promise soars. Qualys, with 10% growth, has now received some of that enthusiasm.
Risks and what to watch
- The next earnings report. Qualys has not yet confirmed the third-quarter date. Market estimates point to Tuesday, November 3, after the close (not this week, but the next). Its own guidance for the quarter is revenue of $185.5 million to $187.5 million.
- Tenable reports on October 28. It will be the sector’s first read, and with a stock that has already risen this much, expectations are high.
- Net retention and billings. If net retention does not keep rising and current billings stay in the 7–8% range, the reacceleration story will lack support.
- AI as a competitor. April’s argument has not gone away: if large models integrate detection and remediation, value may shift toward them.
- Buybacks at a high price. The same program that created value in April could destroy it if executed with the same intensity at more than double the price.
My take
Qualys is a good business that the market has valued in two opposite ways over six months, without the business changing by the same degree. What it has shown is discipline: high margins, abundant cash, no debt, and buybacks when the stock was on the floor. That is the part that does not depend on the story. The part that does depend on it is the current price: at $216, the stock is no longer paying for what Qualys is, but for what it could become if AI boosts demand for remediation. Third-quarter results will begin to clarify whether that reacceleration shows up in the numbers or remains in the conversations. This is analysis, not an investment recommendation.
Dig deeper
- Stock investing guide — basic concepts for making better decisions
Institutional Radar. In Institutional Radar I follow each week earnings, valuations and moves by major investors like those in this analysis, with the figures and their sources. You can get this kind of analysis yourself with an Institutional Radar subscription: subscribe here.
This article is general financial information and does not constitute investment advice. Investing involves risk of loss of capital.
Free community
Register for free access to the community forum
Share analysis, ask questions and connect with other investors — free, in under two minutes.
Create free account