- Chubb posts a record core EPS of $7.66 in Q3 2026 (+0.8%), with investment income also at a record.
- Evan Greenberg warns of “naive” capital in commercial insurance: in North America, commercial property becomes 4.2% cheaper.
- It trades at around 12.1 times its 12-month core EPS (own calculation) and 1.86 times its book value; Berkshire held approximately 9% as of June 30.
Stocks
Chubb stock: record profit and a warning about the cycle
On October 20, Chubb reported the highest core operating earnings per share in its history: $7.66 in the third quarter of 2026, up 0.8% from a year earlier. However, what interests me most about these results is not the record, but what Evan Greenberg said the following day on the analysts’ call. The CEO described the capacity entering commercial insurance as «hungry and extremely naive», and added that in many areas pricing «is failing to keep pace with loss costs». It is not common for a top executive to pair a record with such an explicit warning.
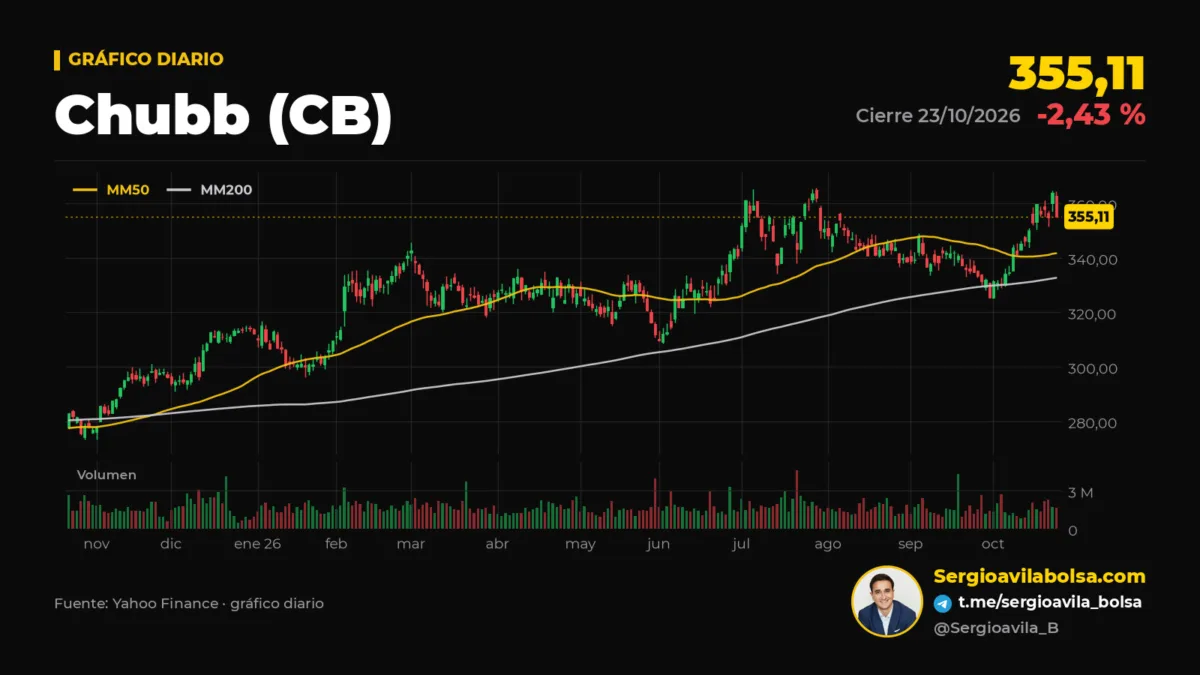
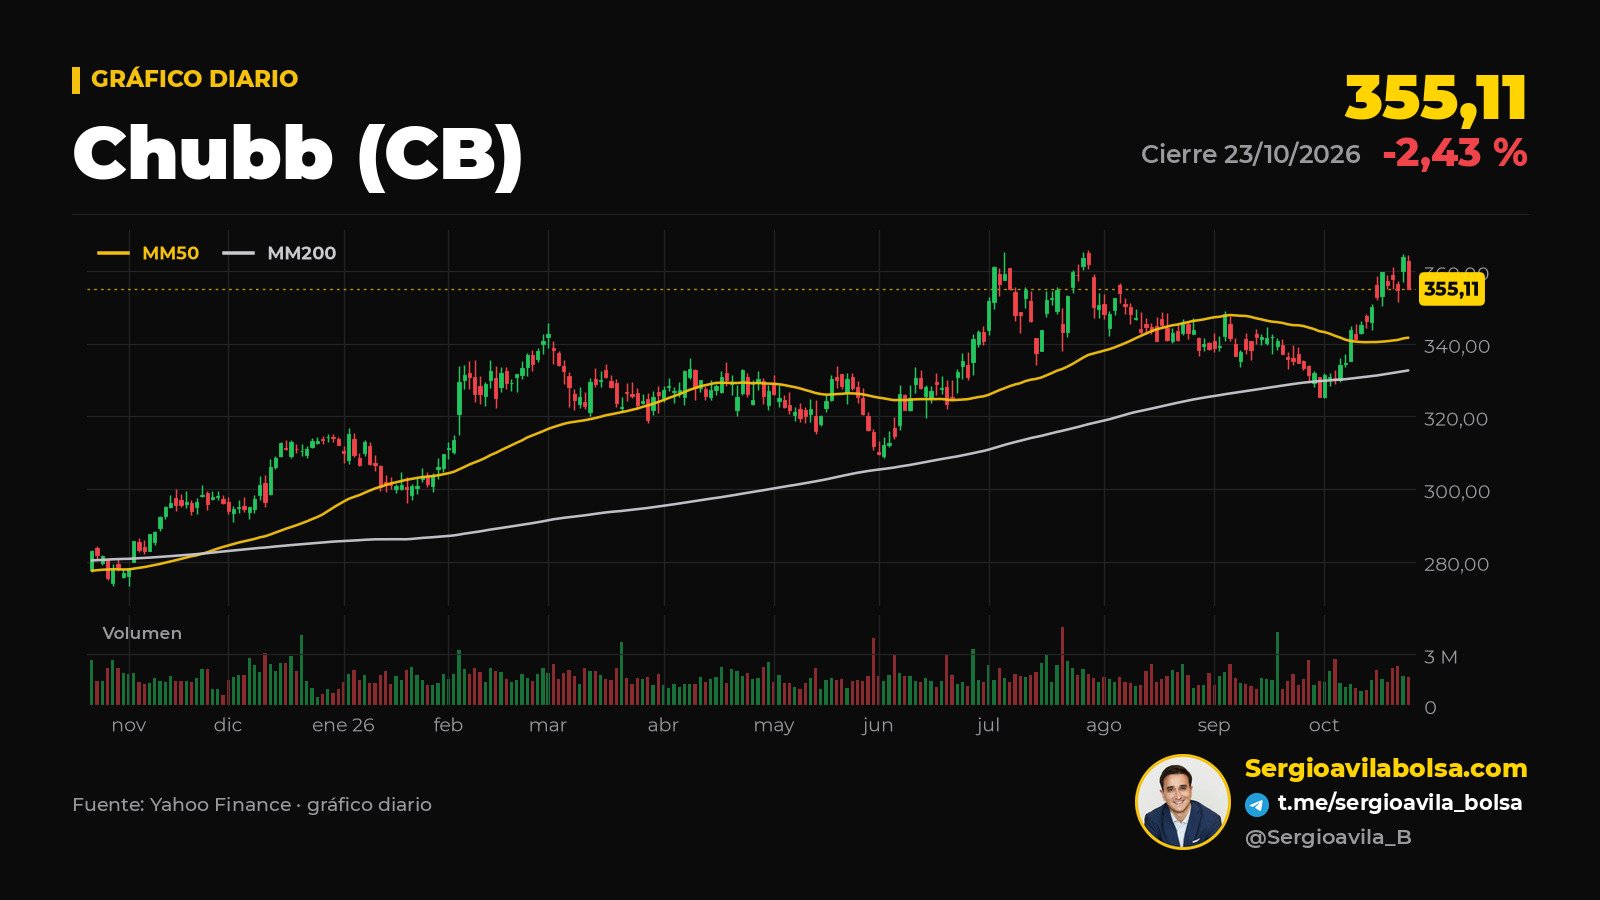
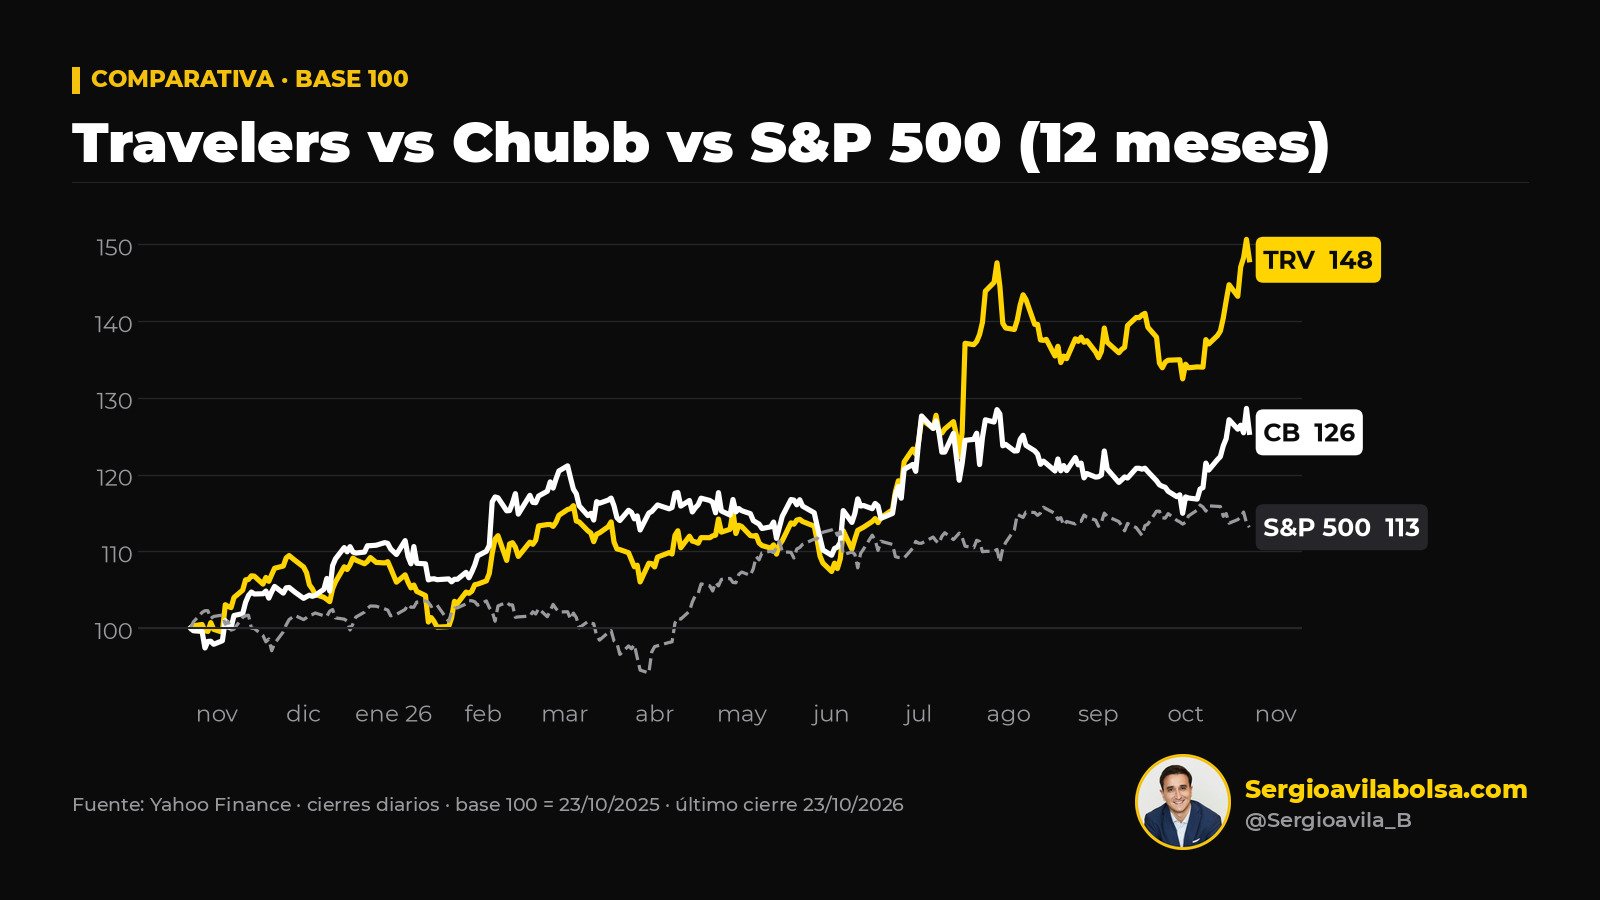
The stock market has treated Chubb shares with more caution than its big rival. On Friday, October 23, they closed at $355.11, down 2.43% in a session of broad selling driven by oil. So far in 2026, the stock is up 13.8%, slightly more than the S&P 500 (+11.4%) and well below Travelers’ 37.3%. Over the past twelve months, the stock has gained 25.5%, and Friday’s close is 2.4% below its 52-week closing high ($363.95, on October 22).
Key Chubb figures in the third quarter: Chubb shares
Chubb shares: updated analysis with context for investors.
| Metric | Figure | Period |
|---|---|---|
| Close | $355.11 (−2.43%) | Friday 10/23/2026 |
| Stock performance | +13.8% (S&P 500: +11.4%) | 2026 through 10/23 |
| Core operating EPS | $7.66 (+0.8%), record | Q3 2026 |
| Net written premiums | $15.143bn (+1.9%) | Q3 2026 |
| P&C combined ratio | 84.1% (81.8% a year earlier) | Q3 2026 |
| Catastrophes | $705m ($285m) | Q3 2026 |
| Net investment income | $1.791bn (+8.6%), record | Q3 2026 |
| Core operating ROE | 14.9% (core ROTE: 21.6%) | Q3 2026, annualized |
| P/E on core EPS | ≈12.1x* | 12 months through Q3 2026 |
| Price / book value | 1.86x (tangible: 2.80x) | Book value at Q3 2026 close |
A solid quarter, with more catastrophes
Net written premiums grew 1.9% in the third quarter, to $15.143 billion, and property and casualty (P&C) premiums also rose 1.9%, to $13.183 billion. The P&C combined ratio worsened to 84.1%, from 81.8% a year earlier, but the reason is clear: catastrophes cost $705 million, versus $285 million. Excluding catastrophes and prior-year development, the current-year ratio was 82.6%, virtually unchanged from 82.5% a year earlier. Underlying underwriting, therefore, barely moved. That was complemented by favorable reserve development of $511 million ($361 million in the same quarter of 2025).
Net investment income hit a record: $1.791 billion, up 8.6% ($1.890 billion on an adjusted basis, +6.3%). Net income was $2.844 billion (+1.5%), or $7.30 per share (+4.4%). It is worth noting one detail: total core operating earnings fell 2.2%, to $2.980 billion, while core EPS rose 0.8%. Buybacks explain the difference. In the first nine months, core EPS totals $21.94, up 24.5%.
Geography as a buffer
What sets Chubb apart is its business outside the United States. Overseas General grew 6.7%, with Latin America up 11.7%, Asia up 7.5%, and Europe up 6.8%. At home, NA Commercial declined 2.7% (+1.7% on an adjusted basis), while NA Personal advanced 5.3% and Agriculture 5.1%. What the cycle takes away in U.S. commercial insurance, the rest of the world is offsetting—at least for now.
Greenberg’s warning
North American pricing shows the problem: in the third quarter, commercial property got 4.2% cheaper, while casualty rose 5.7% and financial lines 2.1%. Greenberg put it this way: «We have been living in a world where the cost of money is cheap, and there is a lot of money looking for absolute return, not risk-adjusted». And he added: «You’re not cash flow underwriting at a 10% or 12% interest rate».
I agree with the diagnosis. Insurance pricing is a signal: it should reflect the risk being assumed. When years of cheap money push capital into the business in search of plain returns, that signal gets distorted and the cost appears later, in the form of underpriced claims. The U.S. 10-year Treasury yield has moved from 3.99% (10/23/2025) to 4.988% (10/23/2026), after touching 5.293% on September 30. Higher rates boost portfolio income, and that shows up in the record investment result. But Greenberg reminds us of the key point: even at these rates, it does not pay to underwrite at a loss and rely on financial income to make up the difference. A higher cost of money rewards discipline; it does not replace it.
Valuation: what I am paying for Chubb
Using my calculation, trailing twelve-month core EPS is $29.46 ($21.94 from the first nine months of 2026 plus $7.52 from the fourth quarter of 2025), putting the P/E at around 12.1 times. There is an important caveat: starting in the third quarter of 2026, Chubb excludes part of intangible amortization from core EPS, and the fourth-quarter 2025 figure has not been restated under that definition. The true P/E under the new definition would therefore be somewhat lower.
Against book value per share of $191.43 (+5.1% year over year), the stock trades at 1.86 times; against tangible book value of $126.96 (+5.7%), at 2.80 times. Travelers, for comparison, trades at about 10.5 times its trailing twelve-month core EPS and 2.8 times book value. Rising rates are also visible in Chubb’s balance sheet: accumulated other comprehensive income (AOCI) stands at -$9.483 billion, versus -$4.975 billion at the end of 2025.
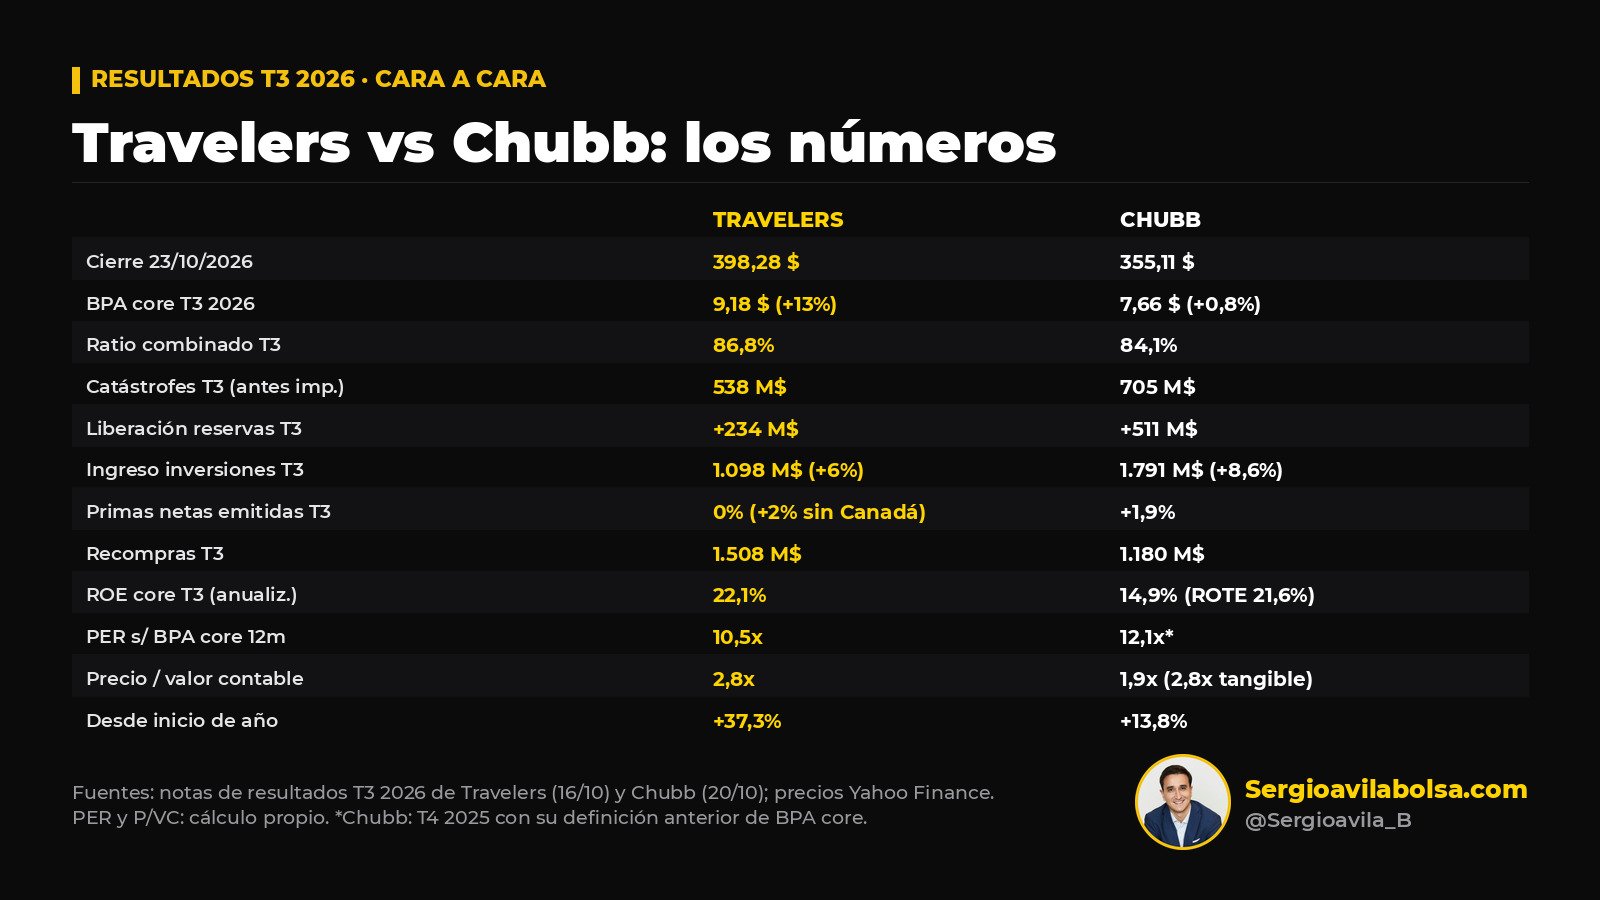
In the third quarter, Chubb returned $1.570 billion to shareholders: $1.180 billion in buybacks, at an average price of $344.32, and $393 million in dividends. In nine months, the total is $4.470 billion, of which $3.300 billion is buybacks. The annual dividend is $4.08 ($1.02 per quarter), after the 33rd consecutive annual increase, with a yield of close to 1.15%. In addition, the company expects a $460 million gain from the sale of USI to Aon.
Berkshire remains in, at least through June
According to its second-quarter 13F (positions as of June 30, 2026), Berkshire Hathaway held 34,249,183 Chubb shares, unchanged from the fourth quarter of 2025. At Friday’s close, they are worth about $12.16 billion, close to 9% of the capital. What it did after June 30 will not be known until the third-quarter 13F, in mid-November.
My take
Chubb is entering the soft part of the cycle in good shape: stable underlying underwriting, a portfolio that is delivering more than ever, and international growth that offsets North America. But the EPS record is increasingly supported by buybacks and investment income, and less by earnings growth, which in absolute terms is already declining. That is why Greenberg’s warning seems more important to me than the headline.
What I will watch in the coming quarters is simple: the current-year ratio excluding catastrophes, commercial property pricing in North America, and whether growth outside the United States maintains its pace. If the first starts to rise while prices keep falling, today’s valuation will stop looking demanding and begin to look expensive. If Chubb maintains discipline while others lose theirs, the cycle will work in its favor when the “naive” capacity withdraws. This is analysis, not an investment recommendation.
To go deeper
- The market session context: Wall Street closes lower: the S&P 500 falls 0.52%
- Stock market investing guide — basic concepts for making better decisions
Institutional Radar. In Institutional Radar I track every week the results, valuations, and moves of major investors like those in this analysis, with the figures and their sources. You can get this kind of analysis yourself with an Institutional Radar subscription: subscribe here.
This article is general financial information and does not constitute an investment recommendation. Investing involves a risk of loss of capital invested.
Free community
Register for free access to the community forum
Share analysis, ask questions and connect with other investors — free, in under two minutes.
Create free account